
Table of Content
- Importing External Data
- Move the chart
- Scale factor
- Analyzing the External Data
- Conclusion
Login VSI released the new version 4.1 which contains new realistic workloads with an improved VSImax calculation. Also a brand new feature is added to import external performance data and overlay this with the VSImax chart. This can help understanding the VSImax chart and activities that happen during the performance test. In this blog post I will show the external data in the Login VSI 4.1 analyzer.
Within the 4.1 release example VSImax data is added which contain external performance data. This data is collected on a VDI environment hosted on VMware vSphere. In this blog post I will use the “Example-test-Office-2013” result.
Please note: This is a personal blog and not an official Login VSI blog post.
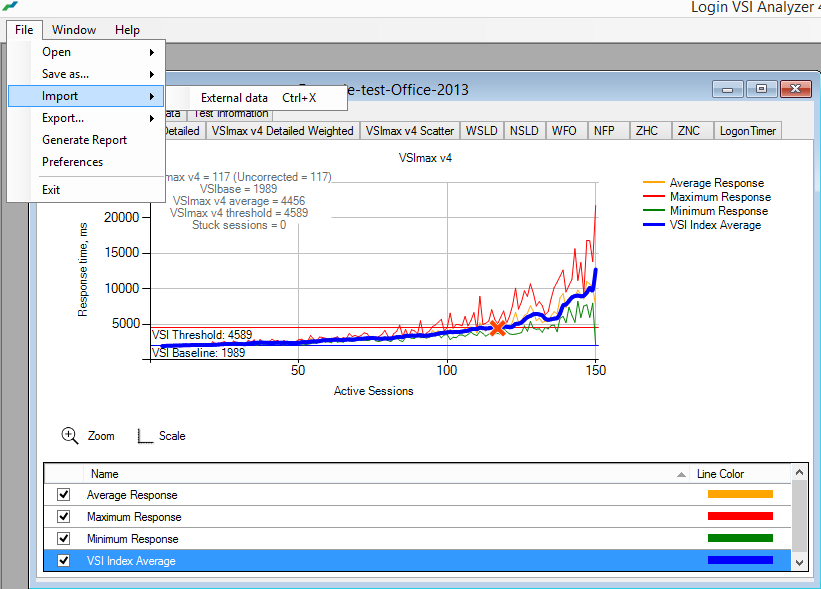
Importing External Data
By opening the result you can import external data by clicking on File - Import - External Data or the key combination CTRL+X.
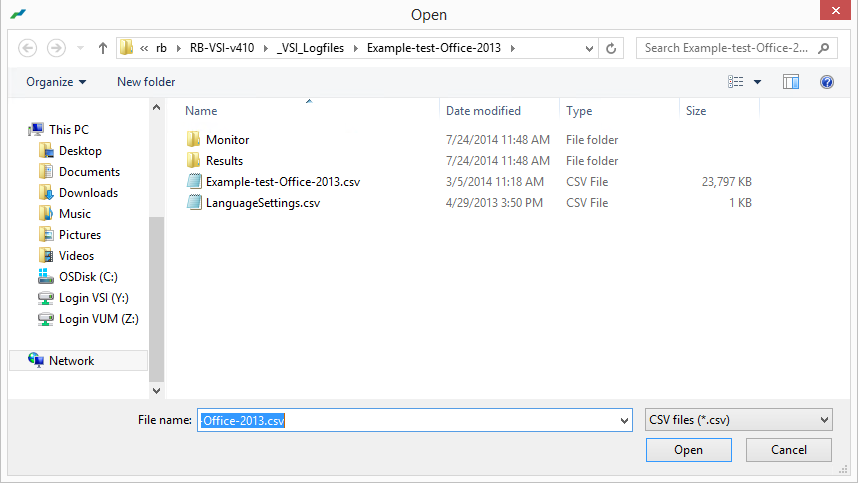
This will open a file open dialog where you can select a CSV formatted file. In this example we are going to open the “Example-test-Office-2013.csv”.
The ESXtop data is loaded and all the metrics are displayed. Because this is a large file this can take a while depending on the performance of your system.
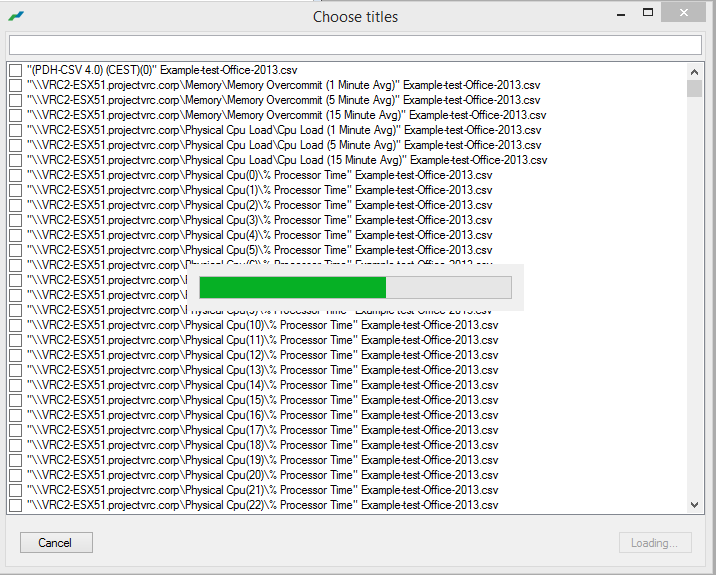
The next step is to select the interesting performance metrics. Within the search bar you can search for metrics. We will open the following metrics:
Physical CPU(_Total)\%Util Time Physical Disk Adapter(vmhba0)\Commands/sec Physical Disk Adapter(vmhba1)\Commands/sec Physical Disk Adapter(vmhba0)\Reads/sec Physical Disk Adapter(vmhba1)\Reads/sec Physical Disk Adapter(vmhba0)\Writes/sec Physical Disk Adapter(vmhba1)\Writes/sec
When all the metrics are selected click open and this will create a new tab in the analyzer called “External Data 1”.
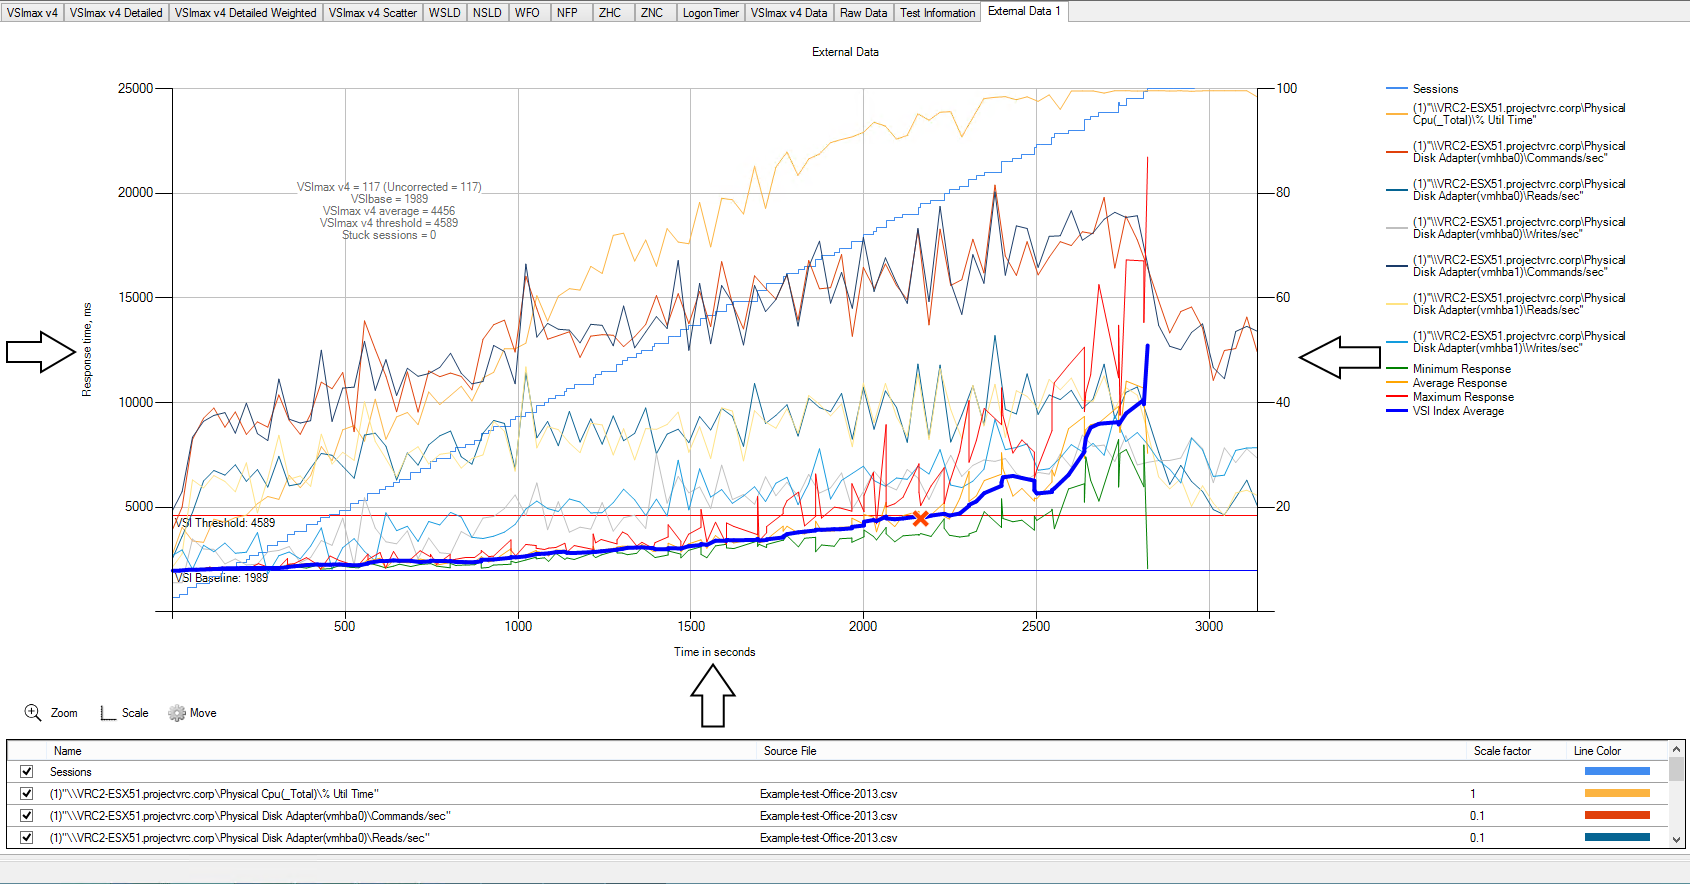
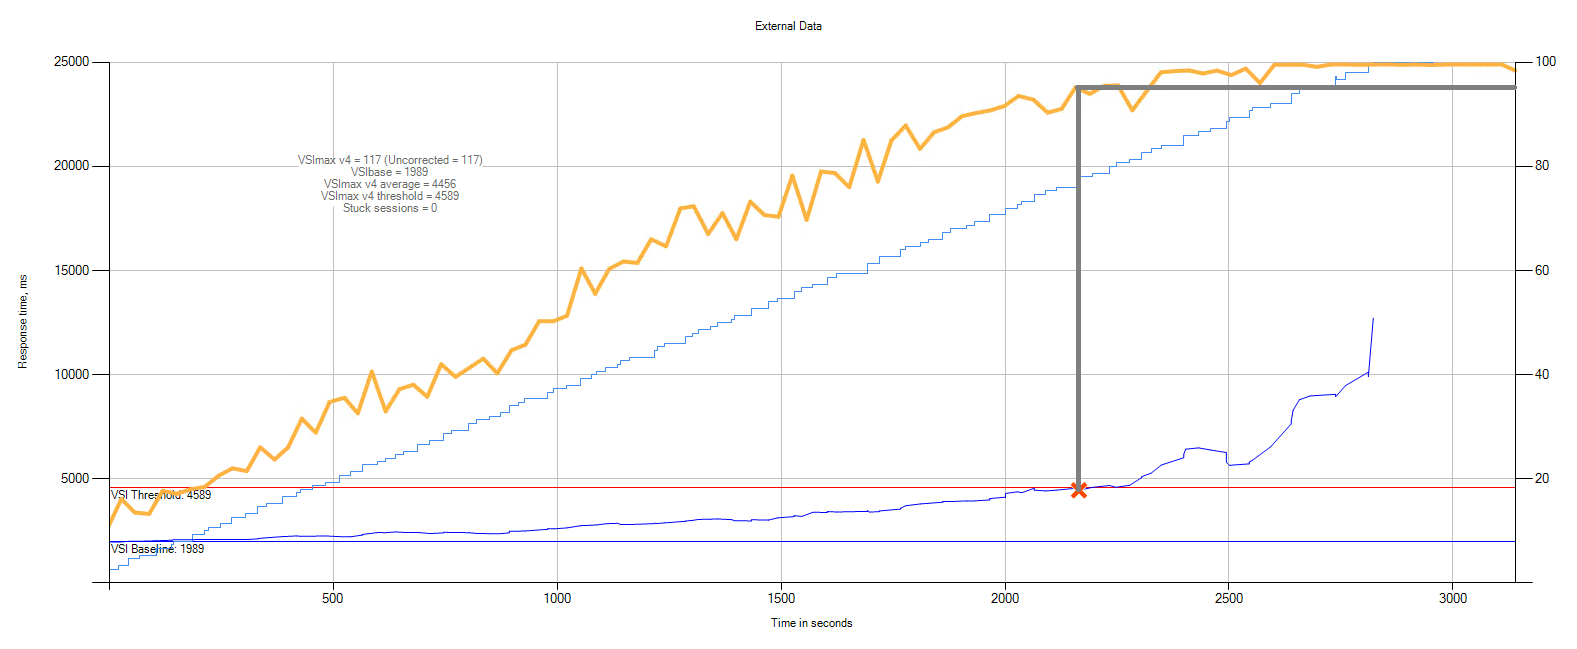
On the left Y axis response time of all the Login VSI metrics are displayed. The right Y axis the imported metrics on a scale from 0 until 100 are displayed. The X axis is the time in seconds.
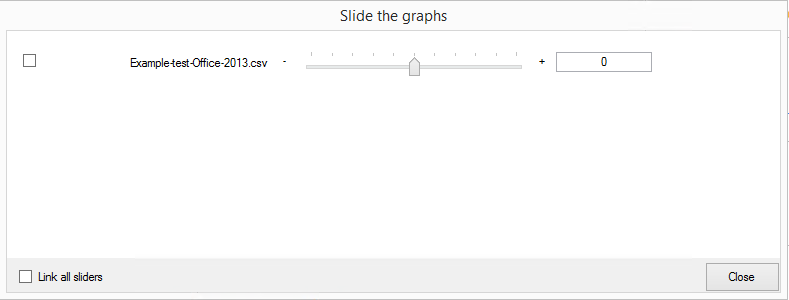
Move the chart
It can happen there is a difference in the performance time stamp and the Login VSI data. Beware of the difference because this can influence your conclusion. The external data can be moved to correct the time offset. Click on the move button and the “Slide the graphs” dialog will open. This allows you to adjust the external data by seconds.
![]()
Scale factor
Each imported metric is adjusted to the correct scale. Because the right Y axis display a scale from 0 until 100 the metric needs to be adjusted. This is done based on the highest number of selected metric and divided or multiplied to make sure it will fit the correct scale. This can be manually adjusted in the “selection window”.
![]()
Analyzing the External Data
To get a better overview I always close the legend overview and disable all the metrics. This way we have a blank canvas and the next step is to enable the “Sessions” metric and “VSI Index Average”.
First we are going to look at the CPU utilization. Enable the following metric in the selection window:
"Physical CPU(_Total)\%Util Time".
When enabling the metric we clearly can see the test bottleneck is CPU related. When hitting the VSImax at 117 users the CPU utilization is 96%.
Lets also take a look at the disk activities during the test. The host has two fiber optics connected to the SAN therefore there are two vmhba. Both 0 and 1 are having approximately the same amount of traffic. Enable the following metrics.
Physical Disk Adapter(vmhba0)\Reads/sec Physical Disk Adapter(vmhba1)\Reads/sec Physical Disk Adapter(vmhba0)\Writes/sec Physical Disk Adapter(vmhba1)\Writes/sec
The scale for both metrics are on 0.1 which means the metric is divided by 10. To get the original value use the following calculation:
[Y axis value] / [scale factor] = original value
You will see there is more reads as writes. There are no extreme spikes or drops which is a good indication and based on that we can conclude no storage bottlenecks are reached.
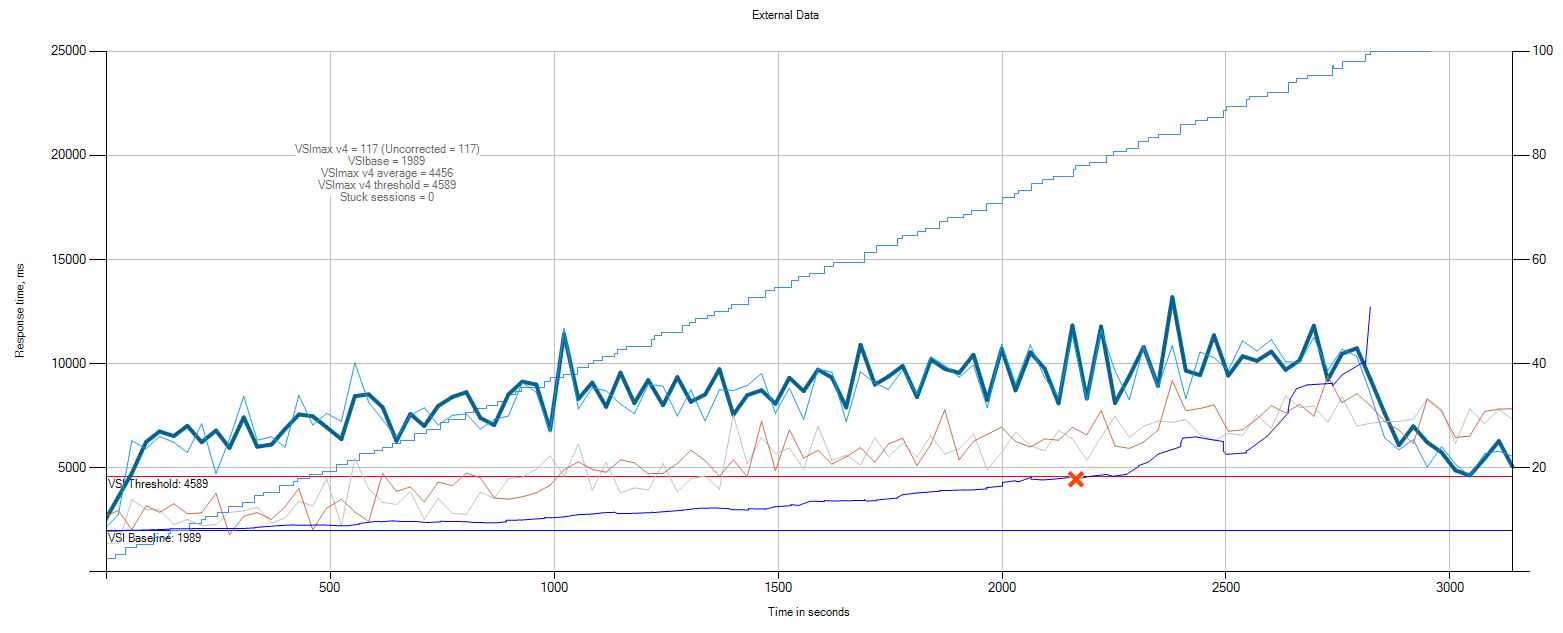
This can also be done for the Commands metrics which is a combination of reads and writes.
If there are strange spikes or drops within the disk metrics you probably need to investigate further and look at the disk latency metrics.
Conclusion
External data in the Login VSI 4.1 analyzer is a really useful feature which lets you understand the performance impact during a test. It can provide crucial information to get the conclusion of a test and understanding the impact of your change. Make sure you always collect external performance data during your Login VSI test because this will help you!
For more information about Login VSI please visit the website.
If you have any questions or comment please leave them below!