Table of Content
Recently a new version of Remote Display Analyzer has been released that contains a lot of improvements and new features. But did you know Remote Display Analyzer is a super powerful tool in performance testing? In this blog post, I will share some tips & tricks regarding the Remote Display Analyzer automation.
About Remote Display Analyzer v.2007
The new version of Remote Display Analyzer was release last month and the following feature are added.
- RDS GPU policy detection, reminder to configure this setting and easily verify if GPU is leveraged for RDS workload.
- Multi language OS support for RDS\WVD.
- Enhanced support for Citrix EDT with MTU size detection, MTU discovery detection and available EDT bandwidth detection.
- The Receiver client version is now detected and displayed next to the detected VDA version.
- Citrix Glyph detection support.
- Citrix build to lossless configuration option has been added.
- Support for the latest Windows 10 Builds.
- Support for the latest Citrix VDA (2006) version.
- Support for the latest VMware Horizon (7.12) version.
- Various fixes and improvements.
For more information please visit Remote Display Analyzer website.
Logging feature
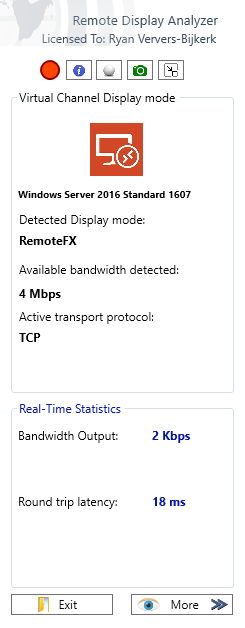
Remote Display Analyzer contains logging functionality that allows you to capture the protocol data in comma separate (CSV) file. This feature is super useful for troubleshoot or performance testing purposes. Using simple automation it allows you to reproducible capture protocol data. There are a couple basics to use the logging feature. In order to start the logging the parameter -logging needs to be specified with the path to the file. This will start Remote Display Analyzer in logging mode which can be identified by the red recoding icon.
In some countries the default delimiter is a , instead of a . which will break the CSV file. Therefore, Remote Display Analyzer is using by default since the 2007 release a ; as the default delimiter. This can be adjusted using the -delimiter parameter, for example -delimiter ",".
By default the data collection interval is 1 second. As this does provide accurate data, when troubleshooting for a longer timeframe this might be too much data. This can be adjusted using the -interval parameter, which is specified in seconds. For example, -interval 5. This will collect the data using a 5 second interval. For performance testing it is recommended to increase the interval to a minimum of 5 seconds to reduce the overhead.
Version 2007 introduced a new parameter which is -samples. This parameter allows to set the amount of samples that need to be collected. For example, when using the -samples 120 with a interval of 5 seconds it will collect data for 10 minutes. This is useful to prevent a data overload by setting the sample limit.
Combining the parameters will result in: RemoteDisplayAnalyzer.exe -logging "%tmp%\%username%-rda.csv" -delimiter "," -interval 5 -samples 120.
Pro tip: When using Remote Display Analyzer with a NVIDIA GPU you might need to disable the GPU capture using the parameter
-disablegpu. Remote Display Analyzer relys on the NVIDIA WMI which can consume high CPU. Latest drivers of NVIDIA does provide more stability, it still might occur, so please keep that in mind.
Interpreting the results
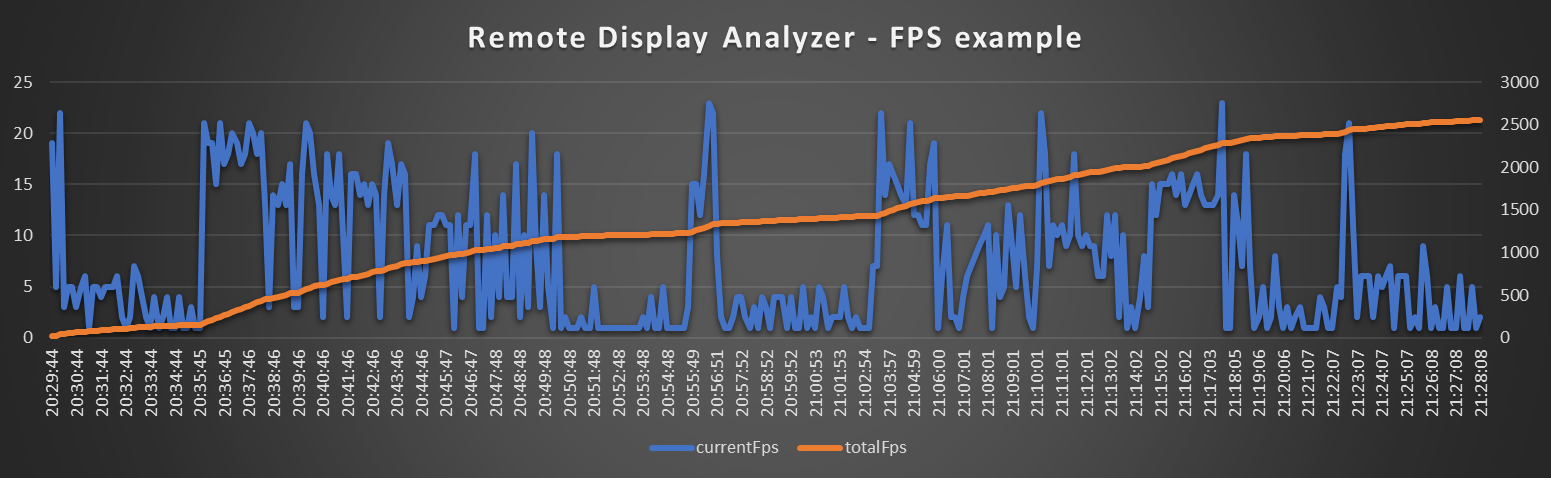
By default all available metrics collected in Remote Display Analyzer are saved in the logging CSV, but this is depending on the used protocol. The results are time based, so the results will always start with a DateTime stamp. There are static results, current and total. A static result is for example resolution or the video codec type, these results are not likely to change over time. A current result, for example the currentFPS is the data collected at that specific moment. The total, for example totalFPS is the summed results of all previous results.
When interpreting the results, it is important to have an understanding of the workload. For example, when you play a video, it is expected to see and increase in FPS and CPU for encoding or GPU usage. It is also recommended to capture multiple runs, to ensure the behavior is reproducible and consistent. This way it is safer to form your conclusions.
To create a chart like the example above, it is recommended to use a spreadsheet product like Microsoft Excel. By formatting the data time column to a Date time format, it is possible to create a chart. It might occur the first line contain a null or the entire column contains a null results. This is due to that Remote Display Analyzer could not collect the data at that time. When this occurs you might need to remove the first line, or verify all data can be collected.
Conclusion
Remote Display Analyzer is a very powerful tool that can be using in your automation to troubleshoot issues. At GO-EUC Remote Display Analyzer is one of the default data sources for all researches. The various parameters allows you to enable the logging, adjusted the interval and delimiter and specify a capture limit. It is recommended to use a spreadsheet product like Microsoft Excel to create charts, which always helps understand and present the results.
Remote Display Analyzer can be downloaded right here. Please note, the subscribed edition is required for the logging feature.
If you needs any help you can always contact Remote Display Analyzer support or leave a comment below.
Photo by Sheri Hooley on Unsplash